Form Analytics & Logs
Note: Analytics and logs makes more sense in the context of data flow.
1. Once you are logged in, you should see a list of forms that you have created:

2. In the list view click the blue eyeball () on the left-side for the desired form.
3. Click the Analytics menu item in the left sidebar.
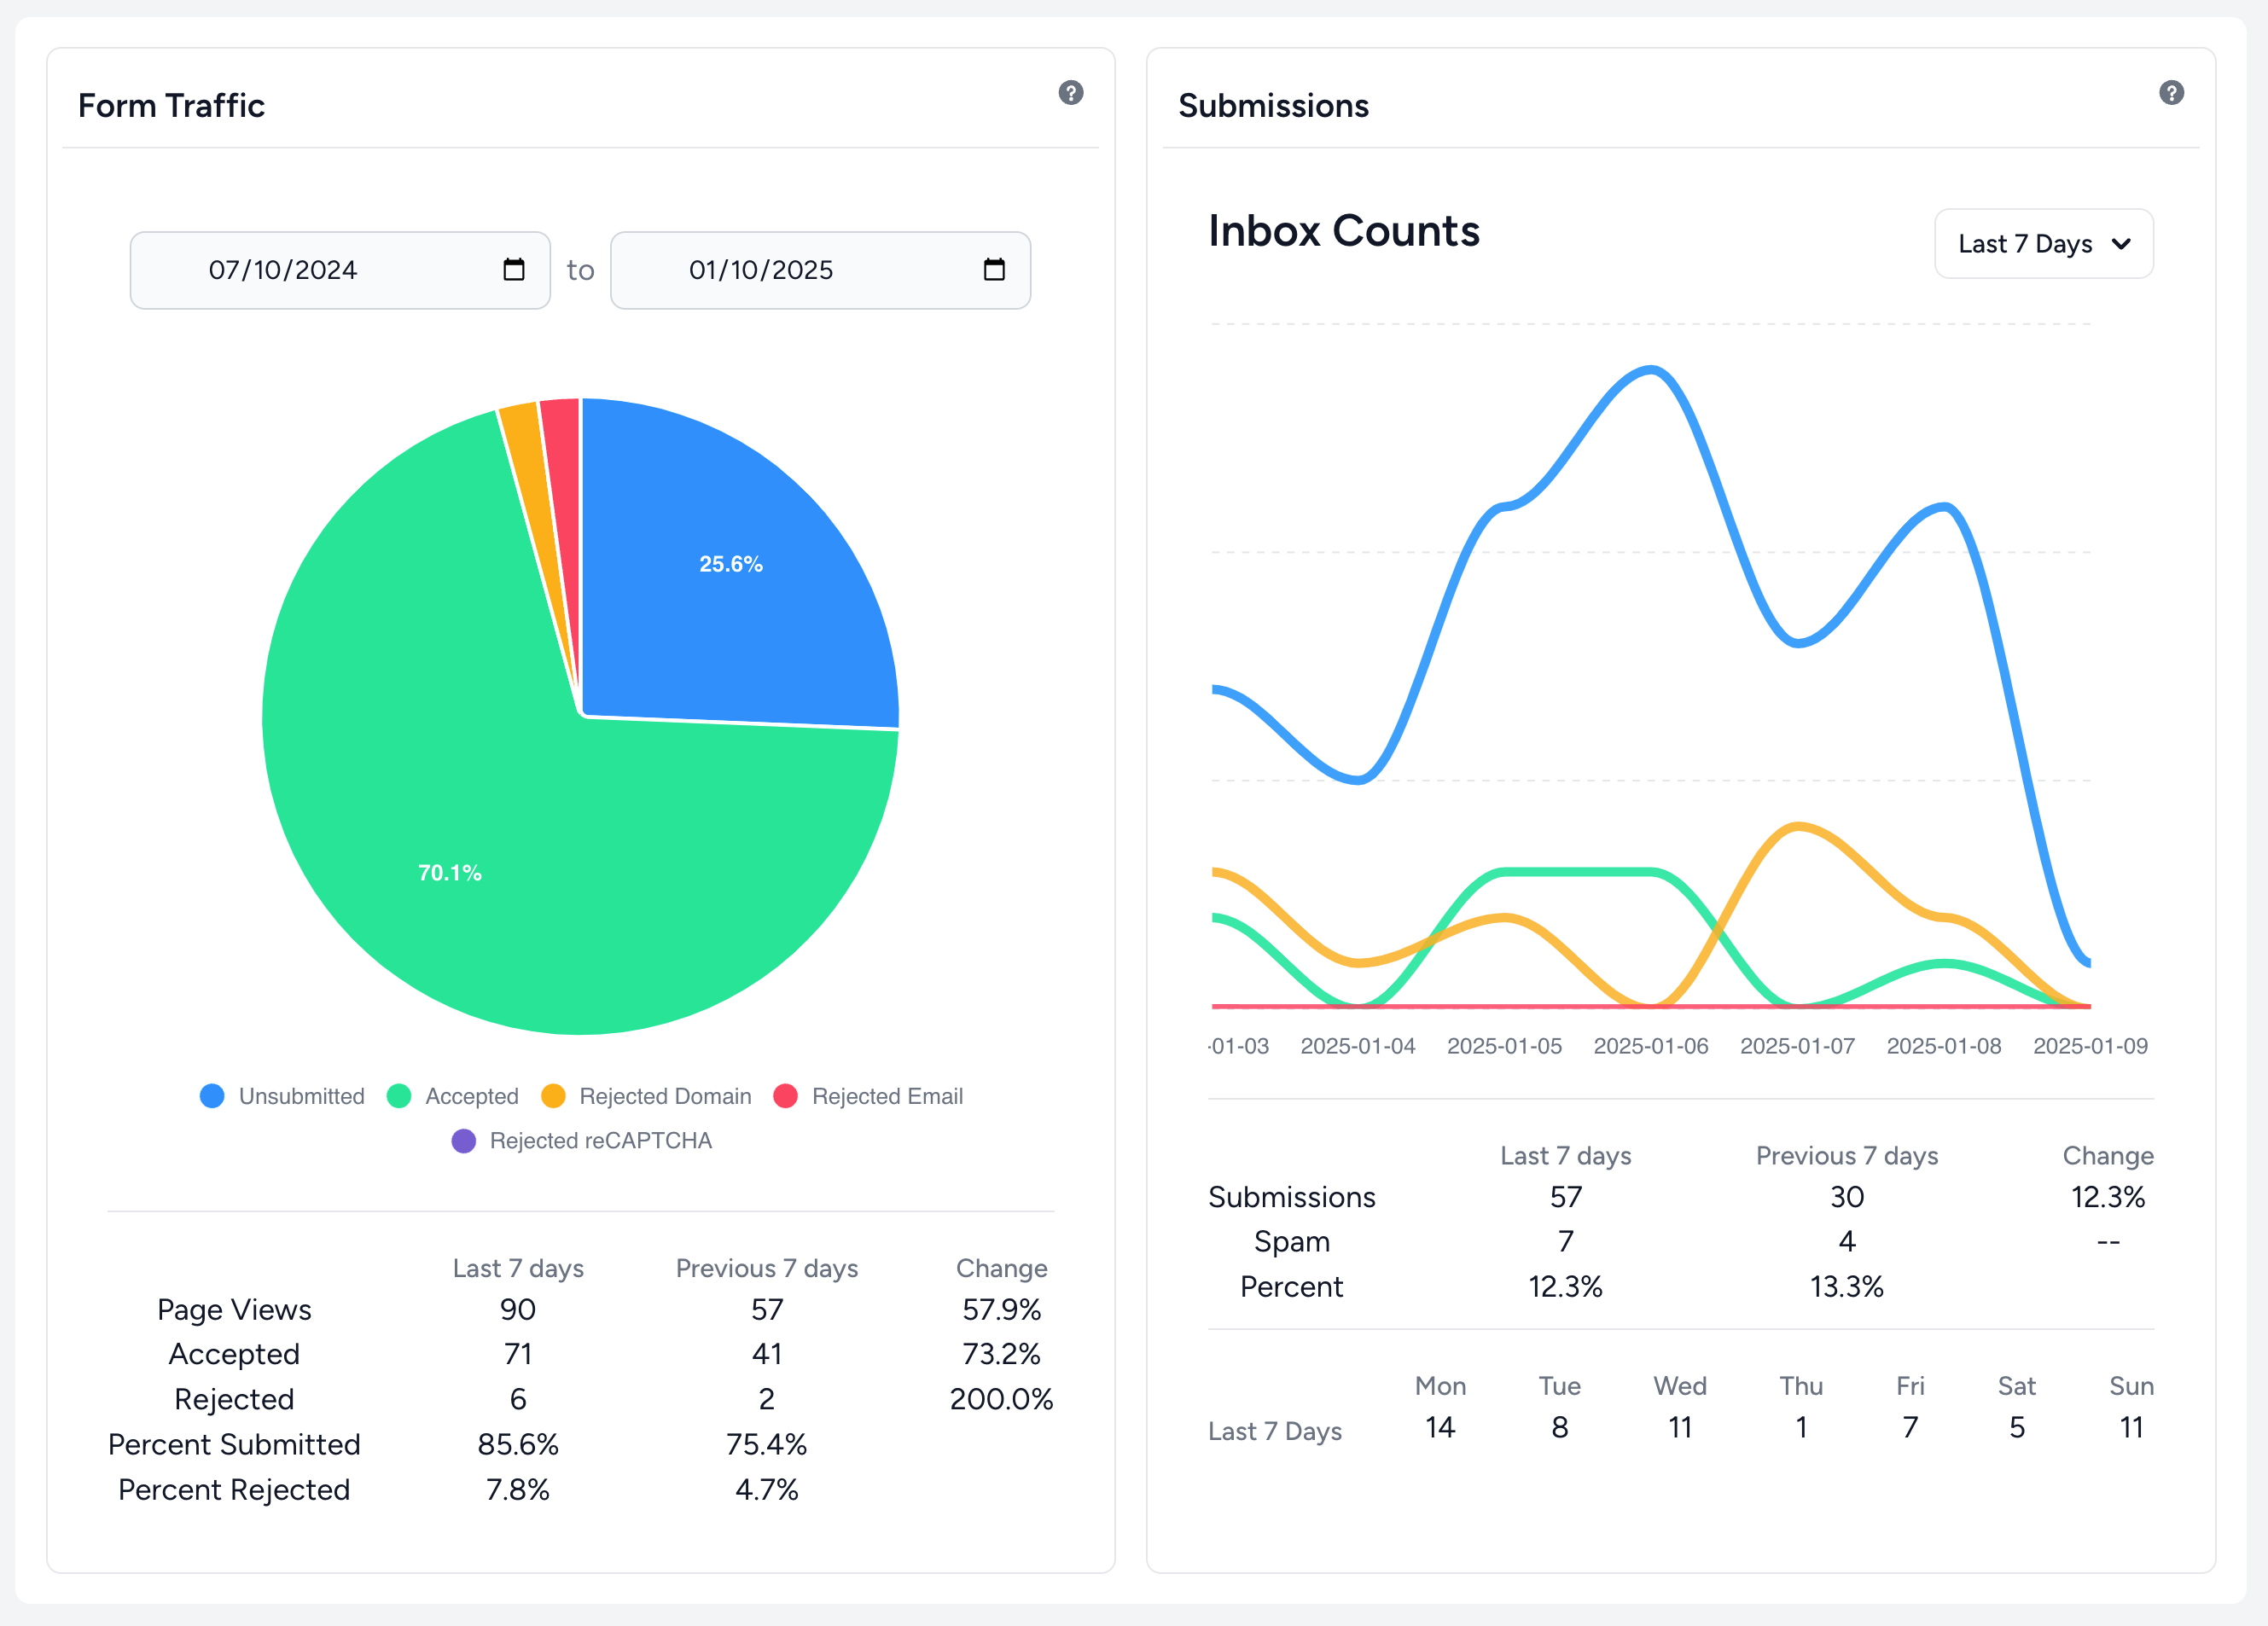
This page displays data for both the traffic and submissions for your form. You can easily see page views, submission / rejection rates, rejection causes, inbox stats, spam rates, and last 7 days versus previous 7 days comparisons.
Note: To see page view you will need to embed the zapl beacon for the form.
4. Click the Logs menu item in the left sidebar.
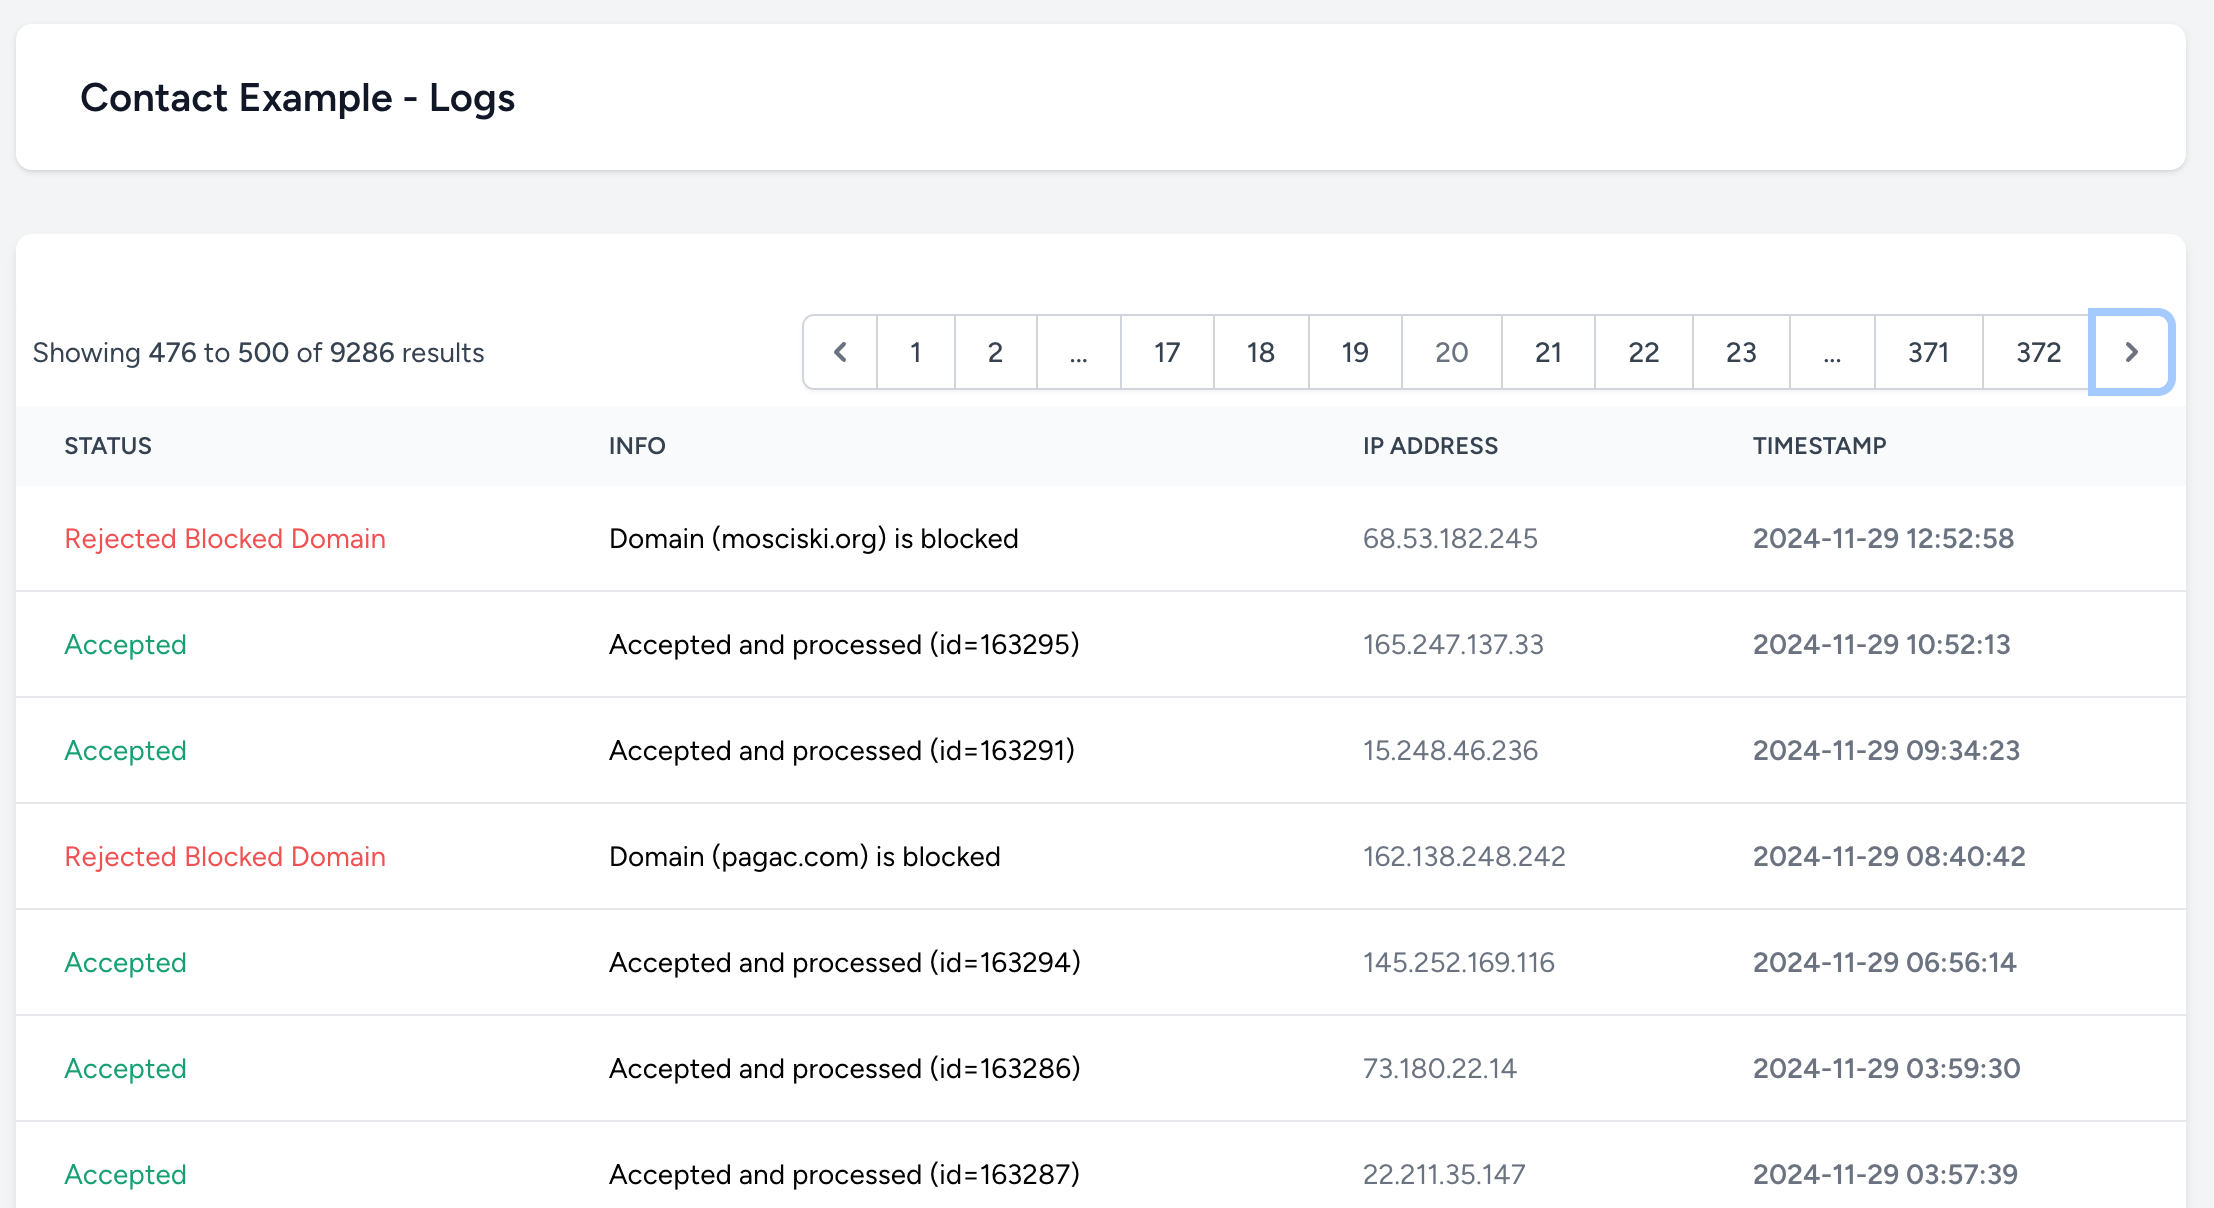
This page displays raw traffic data for each form submission.
You are ready to reCAPTCHA integration..